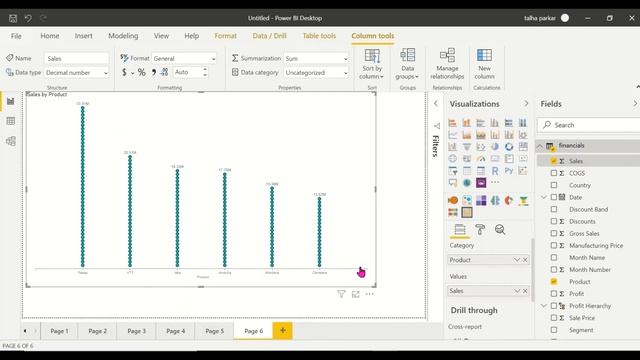
Power BI Custom Visual - Dot Plot
Расскажите об этом видео своим друзьям в социальных сетях!
QR-код страницы с видео

Видео Power BI Custom Visual - Dot Plot
Learn to create a Dot Plot in Microsoft Power BI. Information about the Custom Visual: A dot chart or dot plot is a statistical chart consisting of data points plotted. on a fairly simple scale typically using filled in circles. Show the dis..., видео от 2024-01-18 загрузил на rutube Power BI и BI-аналитика...
